2024 National C-PACE Program Volume Data
| State | Projects (2024 Only) | Dollar Volume (2024 Only) | Total Projects (All Time) | Dollar Volume (All Time) |
| Alaska | 2 | $24,000,000 | 5 | $31,280,000 |
| California | 33 | $709,832,032 | 181 | $2,632,474,234 |
| Colorado | 6 | $20,400,000 | 133 | $285,804,141 |
| Connecticut | 18 | $96,049,419 | 413 | $347,557,259 |
| DC | 2 | $26,064,981 | 54 | $130,295,575 |
| Delaware | 3 | $12,400,000 | 15 | $80,800,000 |
| Florida | 16 | $303,315,000 | 66 | $654,090,000 |
| Georgia | 4 | $13,100,000 | 8 | $29,100,000 |
| Hawaii | 0 | $0 | 0 | $0 |
| Idaho | 1 | $14,900,000 | 1 | $14,900,000 |
| Illinois | 6 | $44,974,857 | 44 | $279,254,995 |
| Kentucky | 9 | $80,000,000 | 20 | $113,000,000 |
| Maryland | 1 | $975,000 | 91 | $140,737,587 |
| Massachusetts | 0 | $0 | 3 | $2,356,478 |
| Maine | 1 | $8,655,189 | 1 | $8,655,189 |
| Michigan | 13 | $46,400,258 | 87 | $308,204,039 |
| Minnesota | 20 | $37,393,784 | 451 | $333,732,355 |
| Missouri | 6 | $92,705,547 | 66 | $314,822,691 |
| Montana | 4 | $2,300,000 | 5 | $7,800,000 |
| Nebraska | 0 | $0 | 43 | $135,883,526 |
| Nevada | 3 | $323,000,000 | 7 | $362,300,000 |
| New Jersey | 0 | $0 | 0 | $0 |
| New Mexico | 2 | $86,375,610 | 2 | $86,375,610 |
| New York State | 3 | $23,500,000 | 35 | $292,709,963 |
| Ohio | 24 | $160,000,000 | 324 | $928,000,000 |
| Oklahoma | 0 | $0 | 10 | $81,484,444 |
| Oregon | 2 | $19,250,000 | 8 | $32,940,000 |
| Pennsylvania | 3 | $45,608,000 | 30 | $297,003,129 |
| Rhode Island | 4 | $29,427,000 | 37 | $116,927,000 |
| Tennessee | 5 | $43,000,000 | 12 | $71,300,000 |
| Texas | 19 | $221,000,000 | 128 | $842,500,000 |
| Utah | 0 | $0 | 11 | $290,000,000 |
| Virginia | 1 | $3,900,000 | 3 | $15,300,000 |
| Washington State | 5 | $54,889,636 | 20 | $279,176,268 |
| Wisconsin | 9 | $29,066,681 | 126 | $256,971,189 |
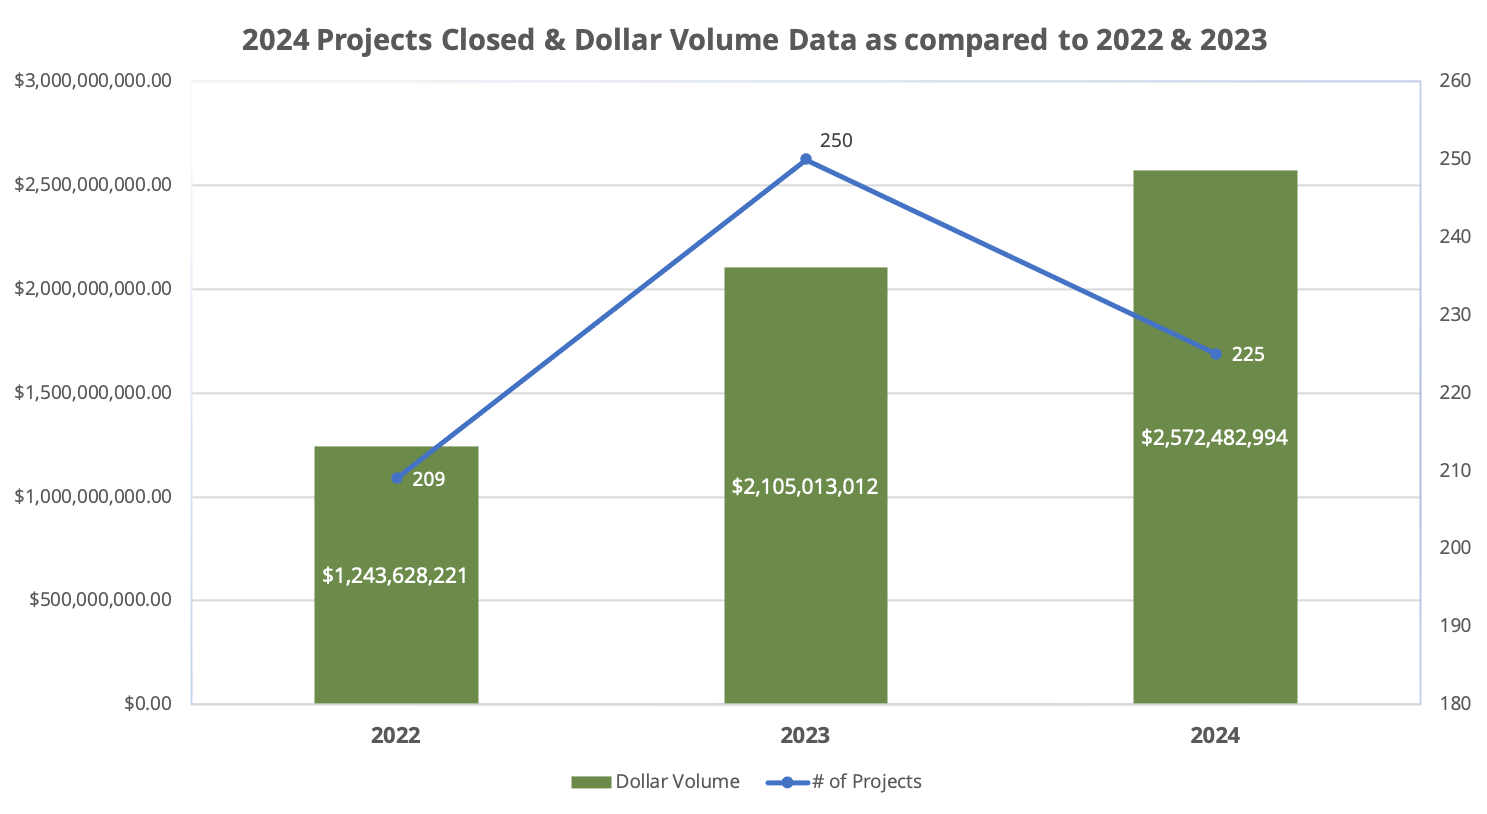
| Totals | 225 | $2,572,482,994 | 2,440 | $9,803,735,672 |
Property of C-PACE Alliance, Inc.